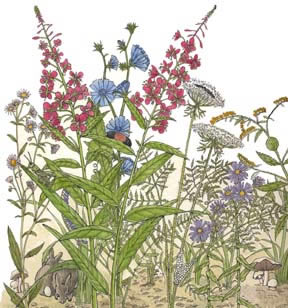

Plants are the most abundant living things in the food web. They also contain the most energy in the food web and supply it for all the other organisms on earth. Even if you are eating a hamburger - it would not exist if that cow did not have plants to eat.
Plants compete with each other for sunlight and space. They begin to grow in the spring when the ground is warm enough and the length of the day supplies enough sunlight to make the food through photosynthesis that they need to grow. Even if it feels hot in February, plants know from the length of the day that it is not time to grow yet.
This simple experiment will show the amazing production of food and energy made by plants.
Age Group: 4th-7th grade
Objectives: Students will be able to see and measure how quickly plants grow, providing food for animals in the food web.
Materials:
Ruler
Graph paper and pencil
Survey tape or string to mark of plot border.
(Optional: Toothpicks and wooden bbq sticks to mark off plants you are measuring.)
Procedures: Studying Biomass
1. Measure off one square foot of plants in the field (that won’t be cut).
2. Mark it with corner sticks and string red survey tape around border.
3. Starting in April, use a ruler to measure how high the plants are each day (or on M/W/F's).
4. Mark down the measurements on graph paper, each box being a half inch of growth to chart the biomass in your plant site.
5. At the end of one month, connect the dots on your biomass chart to see how producers grow.
• You will notice that, after a while, some plants will stop growing taller, but will flower and then go to seed. Some plants will keep growing to catch more sunlight and flower later.
• All that green represents the bottom of the food chain. It is all available energy for herbivores (mice, deer, rabbits, etc.) to eat and increase their biomass in the food web.
• A more advanced study, would be to identify the plants in the square and chart each one together. It is interesting to note that some plants grow earlier and more quickly and then, once their seeds are made, they die back allowing other plants grow. Plants time their growth to decrease competition with other plants in their community.

